


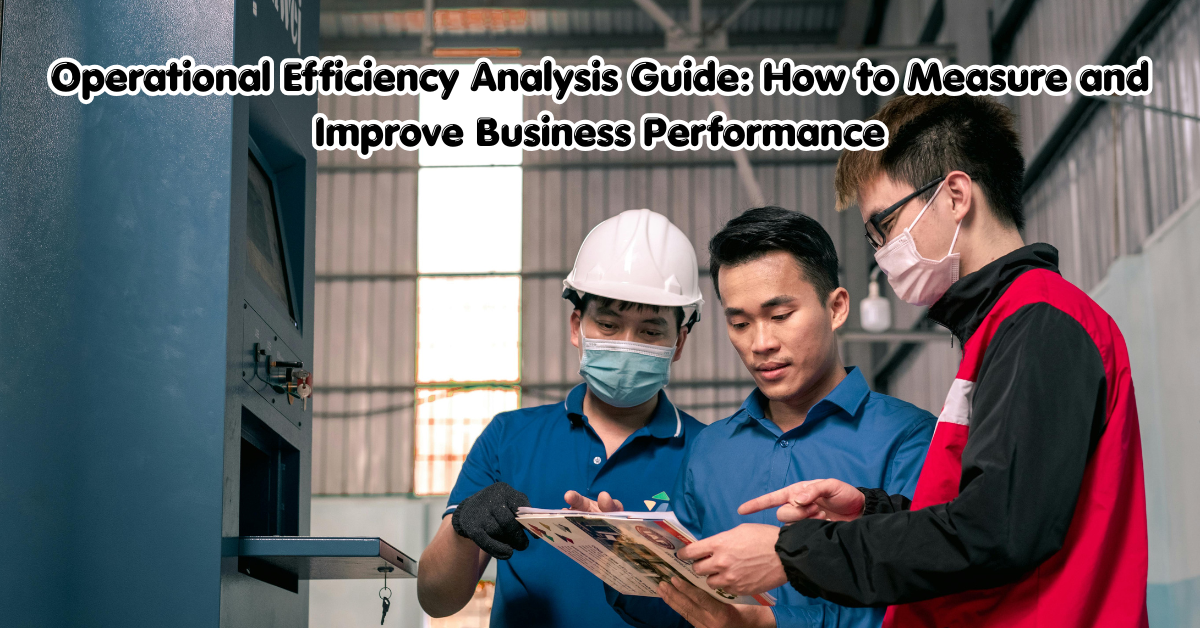
Operational efficiency is one of the most important factors behind a successful business. A company can have great products, talented employees, and strong sales, but if its daily operations are slow, expensive, or full of unnecessary work, growth can become difficult.
An Operational Efficiency Analysis Guide helps businesses understand how efficiently they use their people, time, money, technology, and other resources. The purpose is not simply to cut costs. It is to find better ways to produce the same or better results with less waste and unnecessary effort.
For example, a company may discover that employees spend hours entering the same information into different systems. Another business may have a long approval process that delays customer orders. A manufacturer may lose production time because of equipment downtime. These problems can look different, but they all affect operational efficiency.
This guide explains what operational efficiency analysis means, how to perform it, which metrics to track, common problems to look for, and practical ways to improve business operations.
What Is Operational Efficiency Analysis?
Operational efficiency analysis is the process of examining how a business uses its resources to produce goods, deliver services, or complete work.
In simple terms, it asks:
Are we getting the best possible results from the resources we are using?
Resources can include:
- Employee time
- Labor costs
- Equipment
- Technology
- Materials
- Office space
- Energy
- Capital
- Management time
The results can include:
- Products produced
- Orders completed
- Customers served
- Revenue generated
- Services delivered
- Projects completed
- Customer satisfaction
Operational efficiency generally improves when a business can maintain or increase its output while using fewer unnecessary resources. However, efficiency should never be improved by sacrificing quality, safety, employee well-being, or customer experience.
Why Is Operational Efficiency Analysis Important?
Many operational problems remain hidden because businesses become accustomed to the way work is currently done.
Employees may say, “That’s how we have always done it,” even when a process contains unnecessary steps.
Operational efficiency analysis brings those problems to the surface.
Reduce Unnecessary Costs
An inefficient process can consume more labor, materials, software resources, or time than necessary.
Analyzing the process can reveal where money is being wasted.
Improve Productivity
Productivity is not simply about making employees work harder. It is about helping them spend more time on valuable work.
Removing repetitive administrative tasks can allow employees to focus on activities that require judgment and expertise.
Reduce Delays
Long approval processes, poor communication, manual data entry, and bottlenecks can slow down operations.
Efficiency analysis helps identify where work is waiting.
Improve Quality
Speed alone does not equal efficiency.
If a business produces more units but also creates more defects, returns, or complaints, the operation may not actually be improving.
That is why quality should be considered alongside cost and speed.
Improve Customer Experience
Customers notice operational problems through:
- Late deliveries
- Slow responses
- Incorrect orders
- Repeated requests for information
- Poor support
- Product availability issues
Better operations can create a smoother customer experience.
Operational Efficiency vs. Productivity vs. Effectiveness
These terms are related, but they are not identical.
Operational Efficiency
Efficiency focuses on how resources are used.
The basic question is:
How can we achieve the desired output with less waste?
Productivity
Productivity generally focuses on the amount of output produced from a particular input.
For example:
100 orders processed ÷ 10 labor hours = 10 orders per labor hour
Operational Effectiveness
Effectiveness focuses more on whether the business is achieving the right objectives.
A company can process orders very efficiently, but if it is processing the wrong products or serving the wrong customers, it may still be ineffective.
A useful way to remember the difference is:
Efficiency = Doing work with fewer wasted resources
Productivity = Amount of output produced
Effectiveness = Achieving the intended goal
Strong organizations consider all three rather than focusing on one number.
How to Conduct an Operational Efficiency Analysis
A structured process makes operational analysis easier and more reliable.
1. Define the Objective
Start by deciding what you want to improve.
For example:
- Reduce operating costs
- Shorten delivery times
- Increase production
- Reduce errors
- Improve employee productivity
- Increase customer satisfaction
- Reduce downtime
- Eliminate repetitive work
A clear objective prevents the analysis from becoming too broad.
2. Choose the Process or Department
Do not try to analyze the entire company at once.
Start with an area that has a clear problem or significant business impact.
Examples include:
- Order fulfillment
- Customer service
- Procurement
- Manufacturing
- Inventory management
- Employee onboarding
- Accounting
- IT support
3. Map the Current Process
Document how the work is actually performed.
This is often called the current-state or As-Is process.
For example:
Customer Order → Data Entry → Credit Check → Manager Approval → Warehouse Processing → Shipping
Process mapping can expose unnecessary handoffs, waiting periods, duplicated work, and unclear responsibilities.
4. Identify Inputs and Outputs
List the resources entering the process and the results coming out.
Inputs
- Employee hours
- Materials
- Money
- Information
- Equipment
- Software
Outputs
- Products
- Completed orders
- Customer requests
- Reports
- Revenue
- Services
This creates a basic input-to-output view of efficiency.
5. Collect Reliable Data
Data makes the analysis more objective.
Depending on the business, useful information may include:
- Average processing time
- Cost per transaction
- Number of employees involved
- Error rate
- Rework
- Downtime
- Output volume
- Customer complaints
- Waiting time
- Resource utilization
Do not collect every possible metric simply because it is available. Focus on data that helps answer the original business question.
6. Find Bottlenecks
A bottleneck is a point in a process that limits overall performance.
Imagine a business where five employees prepare customer requests but only one person can approve them.
The approval stage may create a queue.
Look for signs such as:
- Work piling up
- Long waiting times
- Repeated follow-ups
- Overloaded employees
- Delayed approvals
- Idle employees waiting for another department
7. Find the Root Cause
Fixing the visible problem without understanding its cause can lead to temporary results.
A simple method is the 5 Whys technique.
For example:
Problem: Customer orders are being shipped late.
Why? Orders wait too long for processing.
Why? Employees manually verify information.
Why? The system does not automatically validate customer data.
Why? Two systems do not share information.
Why? The integration was never implemented.
The real problem may therefore be system integration rather than employee performance.
8. Identify Waste
Look for activities that consume resources without creating meaningful value.
Common examples include:
- Duplicate data entry
- Unnecessary approvals
- Excessive meetings
- Rework
- Waiting
- Manual reporting
- Unused software
- Poor inventory planning
- Repeated communication
Not every non-value-adding activity can simply be removed. Some activities exist for legal, security, quality, or risk-control reasons.
The goal is to distinguish necessary controls from avoidable waste.
9. Develop Improvement Opportunities
After identifying the problems, create possible solutions.
These might include:
- Simplifying workflows
- Removing unnecessary approvals
- Standardizing procedures
- Improving employee training
- Integrating systems
- Automating repetitive tasks
- Improving scheduling
- Reducing handoffs
- Updating outdated technology
10. Prioritize the Changes
Not every improvement deserves immediate implementation.
A practical approach is to compare:
Business Impact + Cost + Difficulty + Risk
A small change that saves hundreds of employee hours may deserve higher priority than an expensive technology project with uncertain benefits.
11. Measure the Results
After making changes, compare the new results with the original baseline.
For example:
| Metric | Before | After |
| Processing Time | 5 days | 2 days |
| Error Rate | 7% | 3% |
| Manual Steps | 14 | 8 |
| Cost per Order | $12 | $9 |
The exact numbers will vary by business. What matters is having a measurable baseline.
Key Operational Efficiency Metrics
Choosing the right KPIs is one of the most important parts of operational efficiency analysis.
1. Cycle Time
Cycle time measures how long it takes to complete a process from beginning to end.
Formula:
Cycle Time = Completion Time − Start Time
A lower cycle time is often desirable, but only when quality remains acceptable.
2. Cost Per Unit
This measures how much it costs to produce one unit or complete one transaction.
Formula:
Cost Per Unit = Total Operating Cost ÷ Total Units Produced
It can help identify rising production or service costs.
3. Employee Productivity
Employee productivity compares output with labor input.
For example:
Employee Productivity = Output ÷ Labor Hours
The definition of output should match the type of work being performed.
4. Error Rate
Error rate shows how frequently mistakes occur.
Formula:
Error Rate = Number of Errors ÷ Total Transactions × 100
Reducing errors can decrease rework, complaints, returns, and operating costs.
5. Resource Utilization
Resource utilization measures how much of available capacity is actually being used.
Resources may include:
- Employees
- Machines
- Vehicles
- Production lines
- Software infrastructure
Very low utilization can indicate unused capacity, while extremely high utilization may create overload, delays, and reduced resilience.
6. Throughput
Throughput measures how much work a process completes during a specific period.
For example:
500 orders per day
or
2,000 units per week
Tracking throughput can help businesses understand whether improvements actually increase capacity.
7. Downtime
Downtime measures how long equipment, systems, or processes are unavailable.
It is particularly important for manufacturing, logistics, technology, and service operations.
8. First-Pass Yield
First-pass yield measures the percentage of work completed correctly without requiring rework.
A higher first-pass yield generally indicates better process quality.
9. Customer Satisfaction
Operational efficiency should ultimately support customers.
Useful customer-related measures include:
- Customer satisfaction score
- Complaint rate
- Return rate
- Response time
- Resolution time
- On-time delivery rate
Organizations should avoid optimizing internal metrics at the expense of customer outcomes.
These types of KPIs are commonly used across operational efficiency programs, although the right combination depends on the organization’s goals and industry.
Operational Efficiency Formula
There is no single formula that perfectly measures operational efficiency for every business.
A simple conceptual formula is:
Operational Efficiency = Output ÷ Input
For example, if a team processes 1,000 customer requests using 500 labor hours:
1,000 ÷ 500 = 2 requests per labor hour
However, this number alone does not tell the complete story.
If the team processed 1,000 requests but 200 contained errors, the business may have improved output while reducing quality.
Therefore, operational efficiency should be evaluated using a balanced set of measures covering cost, speed, quality, productivity, utilization, and customer outcomes.
Common Operational Efficiency Problems
Most organizations encounter similar types of inefficiencies.
Manual Processes
Employees may spend significant time performing tasks that could be simplified or partially automated.
Examples include:
- Copying information between systems
- Creating repetitive reports
- Manual invoice processing
- Spreadsheet updates
- Repetitive email communication
Too Many Approvals
Multiple approval layers can slow decisions without necessarily reducing risk.
Review whether each approval is still necessary.
Poor Communication
When teams use disconnected systems or unclear communication channels, information can be lost or duplicated.
Outdated Technology
Old systems may require manual workarounds and prevent employees from accessing information quickly.
Duplicate Work
Two departments may unknowingly perform similar tasks.
Process mapping can help reveal this problem.
Lack of Standardization
If every employee performs the same task differently, results may become inconsistent.
Standard operating procedures can improve consistency where appropriate.
Poor Data Quality
Incorrect or incomplete information can create downstream problems.
Improving data collection at the beginning of a process can prevent later rework.
How Technology Can Improve Operational Efficiency
Technology can support operational efficiency, but it should not be treated as the solution to every problem.
Useful technologies may include:
- Workflow automation
- Business intelligence platforms
- Enterprise resource planning systems
- Customer relationship management systems
- Process mining
- Robotic process automation
- Cloud applications
- Artificial intelligence
- Integrated reporting systems
For example, automation may be useful when a task is repetitive, rule-based, predictable, and high-volume.
However, automating a badly designed process can simply make the wrong process faster.
A better sequence is:
Understand → Simplify → Standardize → Automate → Measure
Modern operational guidance also emphasizes measuring whether technology investments actually produce better operational outcomes rather than assuming that automation automatically creates efficiency.
Operational Efficiency Analysis Example
Consider an online retailer that takes four days to process a standard customer order.
An analysis shows the following workflow:
Order Received → Manual Data Entry → Inventory Check → Supervisor Approval → Warehouse Processing → Shipping
The company discovers that:
- Customer information is entered manually.
- Inventory information is updated slowly.
- Every order requires supervisor approval.
- Employees spend time correcting data-entry mistakes.
The company redesigns the workflow:
Order Received → Automatic Validation → Real-Time Inventory Check → Exception-Based Approval → Warehouse Processing → Shipping
The new process does not require a manager to manually review every normal order.
Instead, only unusual orders require additional review.
The business can then track:
- Average order processing time
- Cost per order
- Error rate
- Orders shipped on time
- Customer complaints
This approach allows the company to determine whether the process change actually improved performance.
Best Practices for Operational Efficiency Analysis
Focus on Outcomes
Do not improve a process simply because it has many steps.
Ask whether the change improves an important business outcome.
Involve Frontline Employees
Employees who perform the work every day often understand practical problems that may not appear in management reports.
Their feedback should be combined with measurable evidence.
Use a Balanced Set of KPIs
Do not judge efficiency using cost alone.
A cost reduction that causes quality problems may ultimately hurt the business.
Establish a Baseline
Always understand current performance before implementing major changes.
Without a baseline, it is difficult to prove whether an improvement worked.
Prioritize High-Impact Problems
Start with bottlenecks, expensive activities, frequent errors, and processes that directly affect customers.
Avoid KPI Overload
A dashboard containing dozens of metrics may create more confusion than insight.
Choose a small group of KPIs directly connected to your objective.
Review Processes Regularly
Operational efficiency is not a one-time project.
Customer expectations, technology, regulations, staffing, and business strategies change over time.
Continuous review helps processes remain effective.
Common Mistakes to Avoid
Cutting Costs Without Considering Quality
Lower costs are not useful if customers receive worse products or services.
Measuring Employee Activity Instead of Business Results
Being busy does not necessarily mean being productive.
Focus on meaningful output and outcomes.
Automating Before Simplifying
Automation should support a good process, not hide a bad one.
Ignoring Employees
People who work inside a process can provide valuable information about bottlenecks and workarounds.
Comparing Businesses Without Context
A KPI that works for one company may not be appropriate for another.
Industry, business model, product complexity, customer expectations, and operating conditions all matter. Operational benchmarking should account for differences in workload and complexity.
Operational Efficiency Analysis Checklist
Use this simple checklist when reviewing a process:
- Define the business objective
- Select the process to analyze
- Map the current workflow
- Identify inputs and outputs
- Collect reliable data
- Select relevant KPIs
- Identify bottlenecks
- Find root causes
- Identify unnecessary work
- Gather employee feedback
- Develop improvement ideas
- Prioritize changes
- Test the new process
- Compare results with the baseline
- Monitor performance continuously
Frequently Asked Questions
What is an operational efficiency analysis?
Operational efficiency analysis is the systematic evaluation of how a business uses resources such as time, labor, money, technology, and materials to produce its desired results.
What is the main goal of operational efficiency analysis?
The main goal is to identify waste, bottlenecks, unnecessary costs, delays, and other problems so a business can improve performance without sacrificing quality or customer value.
What are the most important operational efficiency metrics?
Common metrics include cycle time, cost per unit, productivity, error rate, throughput, resource utilization, downtime, first-pass yield, and customer satisfaction.
How do you calculate operational efficiency?
A basic concept is Output ÷ Input Resources. However, businesses should use multiple KPIs because a single ratio cannot capture cost, quality, speed, and customer outcomes at the same time.
What is the difference between efficiency and productivity?
Productivity generally measures how much output is produced from an input, while efficiency focuses on how well resources are used to produce that output.
Can small businesses use operational efficiency analysis?
Yes. Small businesses can benefit significantly from process analysis. They do not need expensive software to begin. Simple process maps, spreadsheets, employee feedback, and a few relevant KPIs can provide useful insights.
How often should operational efficiency be reviewed?
There is no universal schedule. Critical or frequently changing processes may need regular monitoring, while stable processes can be reviewed periodically. The important point is to review performance whenever business conditions, customer expectations, technology, or process results change.
Does automation always improve operational efficiency?
No. Automation can improve efficiency when applied to suitable tasks, but automating an unnecessarily complicated or poorly designed process may not solve the underlying problem.
Final Thoughts
An effective Operational Efficiency Analysis Guide should do more than tell a business to reduce costs or increase productivity. Real efficiency comes from understanding how work moves through the organization, measuring the resources being used, identifying bottlenecks, finding root causes, and improving processes without sacrificing quality.
The strongest approach starts with a clear objective and a reliable baseline. From there, businesses can map processes, select meaningful KPIs, involve employees, identify waste, test improvements, and measure the results.
Remember that operational efficiency is not about making people work harder. It is about designing better ways to work.
When businesses continuously simplify processes, remove unnecessary friction, use resources intelligently, and measure what actually matters, they can build operations that are faster, more reliable, cost-effective, and better prepared for long-term growth.
