


Target Corporation is a major United States retailer that competes through affordable pricing, design-focused products, owned brands and convenient shopping options. Its physical stores remain central to the business, serving both walk-in customers and fulfilling most online merchandise orders.
This Target Corporation company analysis examines how the retailer operates, where it earns revenue, what differentiates it from competitors and which challenges could affect its performance. It uses Target’s fiscal 2025 annual report and subsequently published 2026 quarterly results. The figures represent different reporting periods and are therefore labelled separately.
Target Corporation Analysis at a Glance
| Analysis area | Key finding |
|---|---|
| Core business | General merchandise and food retail |
| Primary market | United States |
| Main revenue source | Merchandise sales |
| Operating model | Stores combined with digital ordering and fulfilment |
| Competitive advantage | Owned brands, design-led assortment and store network |
| Fiscal 2025 net sales | $104.780 billion |
| Fiscal 2025 operating income | $5.117 billion |
| Latest reported quarterly net sales | $26.5 billion in fiscal Q2 2026 |
| Reported workforce | Approximately 415,000 employees as of January 31, 2026 |
| Central challenge | Maintaining differentiation while competing on value and convenience |
| Current strategic direction | Merchandising, customer experience, technology and workforce |
Target’s fiscal 2025 financial year ended January 31, 2026. Its second-quarter fiscal 2026 results were released on August 19, 2026 and provide a more recent, shorter-term view of performance. Target 2025 annual report, Target fiscal Q2 2026 results
Target Corporation Business Overview
Target is a publicly traded American retailer headquartered in Minneapolis, Minnesota. It operates more than 2,000 stores in the United States and sells products through Target.com and its mobile application.
The company offers groceries, apparel, beauty products, household essentials, electronics, toys and home furnishings. This multi-category assortment allows customers to combine necessary and discretionary purchases in a single shopping trip.
Target operates as one reportable business segment. Although the company has different functions, subsidiaries and revenue sources, it reports consolidated results instead of presenting separate operating segments for stores, digital commerce or individual product categories. Target 2025 Form 10-K
How Target Corporation Creates Customer Value
Target’s value proposition combines style, product discovery, affordability and convenience. It aims to give customers access to everyday essentials while also offering distinctive products that make the shopping experience feel more curated.
Three elements are particularly important to this strategy:
- A broad assortment of essential and discretionary merchandise
- Owned and exclusive brands that help differentiate Target from competitors
- Convenient fulfilment through stores, pickup, shipping and same-day delivery
Approximately 30% of Target’s merchandise sales come from owned and exclusive brands. These products can strengthen customer recognition and offer Target greater control over product development and positioning. However, owned brands also create sourcing, inventory and demand-forecasting responsibilities.
The Strategic Importance of Physical Stores
Target’s stores perform two connected roles. They generate in-person sales and act as local fulfilment centres for digital orders.
Stores fulfilled more than 97% of Target’s merchandise sales in each of the three fiscal years through 2025. This arrangement allows Target to use existing locations for pickup, delivery and shipment instead of depending entirely on separate e-commerce warehouses.
The model is valuable because more than 2,000 stores place inventory near many U.S. customers. Its effectiveness still depends on accurate inventory, efficient store operations and reliable order fulfilment.
Target Corporation Revenue Model
Merchandise sales are the foundation of Target’s revenue model. The company purchases products from suppliers and sells them to customers through stores and digital channels.
Target reported the following fiscal 2025 net-sales composition:
| Revenue source | Fiscal 2025 amount |
|---|---|
| Merchandise sales | $102.717 billion |
| Advertising revenue | $915 million |
| Credit-card profit sharing | $522 million |
| Other revenue | $626 million |
| Total net sales | $104.780 billion |
Advertising revenue primarily comes from Roundel, Target’s advertising business. Credit-card profit sharing is connected with the Target Circle credit-card program, while other sources include marketplace, membership and related activities.
Non-merchandise activities remain much smaller than merchandise sales, but they can broaden Target’s revenue mix. Fiscal Q2 2026 results reported 20.1% growth in non-merchandise sales over the comparable quarter, compared with 5% growth in merchandise sales.
Target Corporation Financial Analysis
Target’s fiscal 2025 performance showed pressure on sales and profitability. Net sales declined 1.7% to $104.780 billion, while operating income fell 8.1% to $5.117 billion.
| Financial measure | Fiscal 2025 | Fiscal 2024 | Change |
|---|---|---|---|
| Net sales | $104.780 billion | $106.566 billion | −1.7% |
| Operating income | $5.117 billion | $5.566 billion | −8.1% |
| Operating margin | 4.9% | 5.2% | −0.3 percentage points |
| Net earnings | $3.705 billion | $4.091 billion | Approximately −9.4% |
| Operating cash flow | $6.562 billion | $7.367 billion | Approximately −10.9% |
| Comparable sales growth | −2.6% | 0.1% | Weaker by 2.7 percentage points |
Comparable sales declined because transaction numbers and average transaction amounts both decreased. Target also reported pressure from higher markdowns, purchase-order cancellation costs and merchandise-category mix. Lower inventory shrink and growth in advertising and other revenue provided partial offsets.
What the Fiscal 2025 Results Suggest
Operating income declined faster than net sales, while the operating margin decreased from 5.2% to 4.9%. This indicates that the challenge was not limited to sales volume; profitability was also affected during the period.
The company still generated $6.562 billion in operating cash flow, although this was lower than the previous year. Target also spent $3.727 billion on capital expenditures in fiscal 2025. This reflects continued investment but does not, by itself, show whether every project will produce an adequate return.
More Recent Fiscal 2026 Performance
Target’s results improved during the first half of fiscal 2026. In fiscal Q2 2026, net sales increased 5.3% year over year to $26.5 billion, while comparable sales grew 3.8%.
Comparable store sales increased 2.7%, and comparable digital sales rose 8.7%. Comparable customer traffic increased 3.6%, suggesting that the quarterly growth was supported by more transactions rather than price or basket size alone.
These results represent a stronger short-term direction following fiscal 2025’s decline. However, one or two quarters should not automatically be treated as proof of sustained long-term recovery. Full-year results will provide a more complete comparison.
Target Corporation Operational Analysis
Target’s operations connect sourcing, inventory management, stores, supply-chain facilities and digital fulfilment. The company reports 66 supply-chain facilities across 25 states, supported by nearly 60,000 team members.
The extensive store network is a major operational asset. It places merchandise near customers and supports services such as pickup and same-day delivery.
This approach also creates operational complexity. Store teams must support traditional shopping while processing digital orders, maintaining accurate inventory and providing customer service. Poor execution in one area can affect several channels simultaneously.
Product and Supply-Chain Exposure
Approximately half of the merchandise Target offers is sourced outside the United States, with China identified as its largest country of origin for imported goods. The company uses measures such as supplier negotiations and sourcing diversification to manage tariff exposure.
International sourcing allows Target to support a broad assortment, particularly its owned brands. It also exposes the business to tariffs, transportation disruption, supplier performance and changes in trade policy.
Target Corporation Market and Competitor Analysis
Target competes across multiple retail categories, which means no single company represents every competitive threat. Its major competitors include Walmart, Amazon, Costco, grocery chains and specialty retailers.
| Competitor | Main area of competition | Target’s relevant differentiator |
|---|---|---|
| Walmart | Price, groceries and general merchandise | Design-led assortment and owned brands |
| Amazon | Online selection, technology and delivery | Physical-store access and local fulfilment |
| Costco | Membership value and bulk purchasing | Smaller purchase quantities and broader shopping occasions |
| Grocery retailers | Food and household essentials | Combination of essentials with apparel, beauty and home products |
| Specialty retailers | Beauty, electronics, apparel and home | Multi-category convenience |
Target’s brand and assortment help distinguish it, but customers can compare prices and products quickly across digital channels. Target’s annual report recognizes that price, convenience, product availability and digital capabilities all influence its competitive position.
Target Corporation Strengths
Strong and Recognizable Brand
Target’s Bullseye identity and established U.S. presence provide broad brand recognition. This makes it easier to support new products, partnerships and loyalty programs under a familiar retail name.
Extensive Store Network
More than 2,000 stores give Target significant physical reach. The same network supports in-store shopping and digital fulfilment, improving the usefulness of each location.
Owned and Exclusive Brands
Target’s owned brands help differentiate its product range and reduce direct product-for-product comparisons. They also allow the company to create products around particular customer needs and price levels.
Multi-Category Shopping
Target combines groceries and household essentials with apparel, beauty, electronics and home products. This assortment can increase convenience and create opportunities for customers to add discretionary products to essential shopping trips.
Growing Digital and Non-Merchandise Activity
Digitally originated merchandise sales increased from $19.4 billion in fiscal 2023 to $21.1 billion in fiscal 2025, even though total merchandise sales declined during that period. Recent quarterly results also showed growth in digital comparable sales and non-merchandise revenue.
Target Corporation Weaknesses and Challenges
Recent Annual Sales and Profit Pressure
Fiscal 2025 net sales, comparable sales, operating income and net earnings all declined from the previous year. Although fiscal 2026 quarterly results have improved, longer-term consistency still needs to be demonstrated.
Dependence on Merchandise Sales
Merchandise accounted for approximately 98% of Target’s fiscal 2025 net sales. Advertising, memberships and other revenue streams are growing, but the company remains highly dependent on retail demand.
Complex Store-Based Fulfilment
Using stores for fulfilment is an advantage when execution is strong. It can become a weakness if inventory records, staffing, product availability or order processing fail to meet customer expectations.
Sensitivity to Discretionary Spending
Some Target categories, including apparel, home décor and electronics, depend more heavily on discretionary spending. Customers may postpone these purchases when household budgets are under pressure.
Major Risks Facing Target Corporation
Target’s annual report identifies several categories of business risk. These disclosures describe possibilities that could affect performance; they do not mean every risk will occur.
Competitive Risk
Target must compete on price, convenience, product selection, digital experience and service. Competitors with larger technology, logistics or pricing capabilities may put pressure on sales and margins.
Demand-Forecasting and Inventory Risk
Retailers must order products before knowing the exact level of customer demand. Incorrect forecasts can lead to unavailable products or excess inventory requiring markdowns.
Reputation Risk
Public perception can affect relationships with customers, employees, vendors and communities. Target’s size and visibility mean that operational decisions and public controversies can receive significant attention.
Supply-Chain and Tariff Risk
Imported merchandise creates exposure to trade-policy changes, tariffs, supplier disruptions and transportation costs. Owned-brand products may involve longer lead times and greater responsibility for sourcing and inventory.
Technology and Cybersecurity Risk
Target depends on technology for payments, inventory, digital shopping, fulfilment and customer data. System interruptions, cybersecurity incidents or failures in new technology could affect operations and trust.
Target Corporation Strategic Priorities
CEO Michael Fiddelke has outlined four major priorities for Target:
- Lead with merchandising authority.
- Improve the guest experience.
- Accelerate technology.
- Strengthen employees and communities.
The strategy focuses on areas where Target believes it can create a distinctive shopping experience. Its success should eventually appear in measurable indicators such as traffic, comparable sales, product availability, customer satisfaction and operating margin.
Technology is particularly important because it supports personalization, inventory management, digital commerce and employee productivity. However, technology investment creates value only when it improves customer experience, efficiency or financial performance.
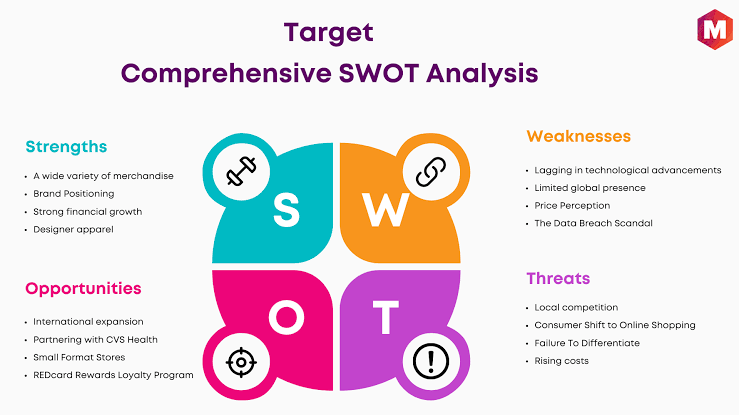
Target Corporation SWOT Analysis Summary
| Strengths | Weaknesses |
|---|---|
| Recognizable retail brand | Fiscal 2025 sales and profit declines |
| More than 2,000 U.S. stores | Heavy dependence on merchandise sales |
| Strong owned-brand portfolio | Complex store-based fulfilment |
| Physical and digital integration | Exposure to discretionary spending |
| Broad product assortment | Margin pressure from markdowns and costs |
| Opportunities | Threats |
|---|---|
| Continued digital sales growth | Competition from Walmart and Amazon |
| Expansion of advertising and memberships | Tariffs and supply-chain disruption |
| Better use of technology and data | Rapid changes in customer preferences |
| Store expansion and modernization | Cybersecurity and data-privacy risks |
| Greater customer loyalty engagement | Reputational and regulatory challenges |
This table summarizes the analysis rather than replacing a dedicated Target Corporation SWOT assessment. Each point should be reviewed when new financial or operational information becomes available.
Overall Assessment of Target Corporation
Target has valuable competitive assets: a recognized brand, a large store network, a differentiated owned-brand portfolio and an operating model that links stores with digital fulfilment. These capabilities give the company several ways to serve customers and compete beyond price alone.
Fiscal 2025 nevertheless exposed performance challenges. Net sales, operating income and customer traffic declined, while operating margin also weakened. Stronger results in the first two quarters of fiscal 2026 indicate improved momentum, particularly in traffic, digital sales and non-merchandise revenue.
The central question is whether Target can sustain that improvement while protecting margins and maintaining a differentiated customer experience. Future analysis should monitor full-year comparable sales, operating margin, inventory performance, digital growth and returns from planned investments.
Frequently Asked Questions
What Is Target Corporation’s Main Competitive Advantage?
Target’s main advantage is its combination of owned brands, design-led products, broad merchandise selection and convenient store-based fulfilment. These elements help differentiate the company from retailers competing mainly on price or online selection.
How Does Target Corporation Generate Revenue?
Most revenue comes from merchandise sales through stores and digital channels. Target also earns revenue from advertising, credit-card profit sharing, memberships, marketplace activity and related services.
Is Target Corporation Financially Growing?
Target’s fiscal 2025 net sales and operating income declined from fiscal 2024. However, fiscal Q2 2026 net sales and comparable sales increased year over year, indicating stronger recent performance. A full-year comparison is needed to determine whether this improvement is sustained.
What Are Target Corporation’s Biggest Risks?
Important risks include intense competition, inaccurate demand forecasting, inventory problems, tariffs, supply-chain disruptions, cybersecurity threats and changes in customer perceptions.
Who Are Target Corporation’s Main Competitors?
Target’s leading competitors include Walmart, Amazon and Costco. It also competes with grocery stores, department stores and specialist retailers in individual product categories.
What Should Be Monitored in Future Target Company Analysis?
Important indicators include comparable sales, customer traffic, digital growth, operating margin, inventory performance, advertising revenue and progress against management’s strategic priorities.
Conclusion
This Target Corporation company analysis shows a retailer with powerful brand and operational assets facing demanding competition and the need for consistent execution. Its stores, owned brands and digital capabilities provide meaningful strengths, while merchandise dependence, sourcing exposure and recent annual profit pressure create important challenges.
Fiscal 2026 quarterly growth offers evidence of improving momentum, but it should be assessed against Target’s eventual full-year results. The company’s longer-term performance will depend on whether investments in merchandise, customer experience and technology translate into sustained sales growth and healthier margins.

1 Comment
Pingback: How Does Target Make Money? Business Model